
Here is the uncomfortable part of financial independence: your salary is not in the equation. Two people earning LKR 400,000 and LKR 4,000,000 a month who both save 30% of it reach independence in the same 28 years.
What is in the equation is the share you keep — and it doesn't reward you linearly. Going from saving 20% to 30% buys back nearly nine years. Going from 30% to 50% buys back another eleven.
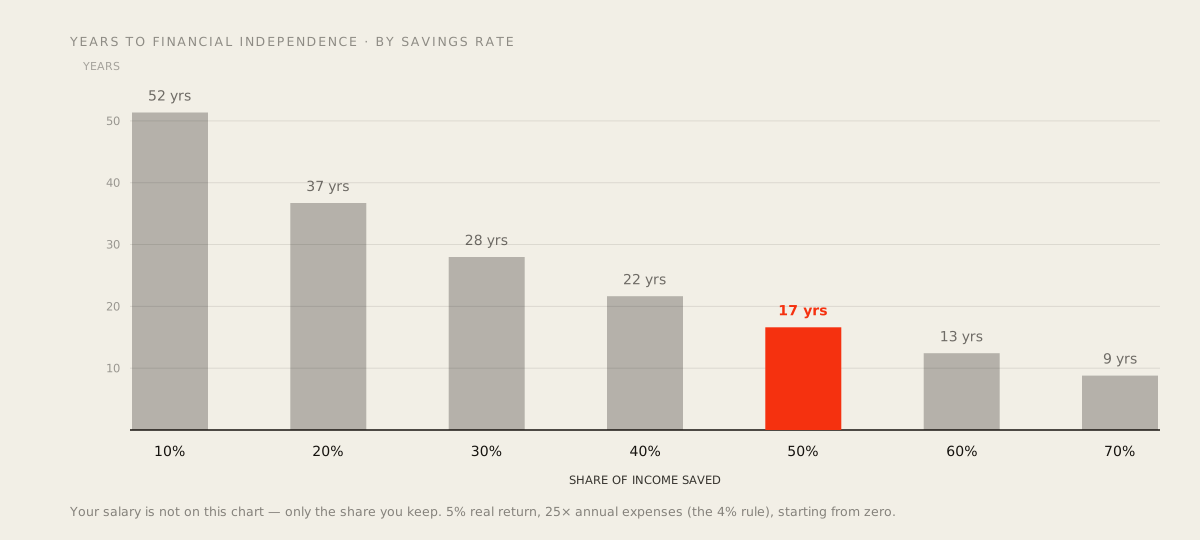
The curve is steep because every rupee you don't spend does two jobs at once: it adds to the portfolio, and it lowers the target the portfolio has to reach. Raising your income only does the first.
Why savings rate beats salary
Two people earning very different salaries can reach financial independence in the same number of years, if they save the same proportion of their income. A high earner who spends everything they make never gets closer, no matter how large the raises get; a modest earner who saves consistently does, on a predictable schedule.
That's because financial independence isn't a salary target. It's a ratio between what you've built and what you spend. Income determines how comfortable the process feels; it's savings rate that determines how long it takes.
Where the 25x number comes from
The most-cited framework here is the Trinity Study, a 1998 analysis by three Trinity University finance professors who tested historical US stock and bond returns from 1926–1997 against 15–30 year retirement periods. Their finding: a portfolio can sustain a 4% initial withdrawal rate, adjusted for inflation each year, with a 95%+ historical success rate over a 30-year retirement.
Flip that percentage over (1 ÷ 0.04) and you get the 25x rule: financial independence arrives once your invested portfolio is worth 25 times your annual expenses. Spend LKR 1,500,000 a year and your FI number is LKR 37,500,000, not a fixed target regardless of lifestyle, but one that moves with your own spending.
Two caveats worth carrying with this number: the 30-year horizon assumes a traditional retirement age, so someone retiring at 35 may need their portfolio to last 50–60 years, not 30. Some FIRE planners use a lower withdrawal rate (3–3.5%) for that reason. And the study is built on historical US market returns; it's a well-tested planning heuristic, not a guarantee.
The table that actually matters
Once you accept the 25x target, years-to-FI becomes a function of savings rate alone: not salary, not portfolio choice beyond a reasonable long-term return. Modelling a 5% real (after-inflation) annual return, contributing a fixed share of income every year toward a 25x-expenses target:
| Savings rate | Years to financial independence |
|---|---|
| 10% | 52 |
| 15% | 43 |
| 20% | 37 |
| 25% | 32 |
| 30% | 28 |
| 40% | 22 |
| 50% | 17 |
| 60% | 13 |
| 70% | 9 |
| 80% | 6 |
Source: modelled by Salli, using annual compounding at a 5% real return, contributions equal to savings rate × income, target equal to 25× annual expenses (the 4% rule).
The curve isn't a straight line. Going from a 10% to a 20% savings rate cuts 15 years off the timeline. Going from 50% to 60% only cuts 4. The biggest gains are available to whoever is currently saving the least, which is the opposite of how most advice ("just invest in index funds") gets targeted.
Shortening it, honestly
There's no shortcut that doesn't involve either earning more, spending less, or both. The table above has no hidden third lever. What changes the number is moving along that savings-rate axis, and moving along it consistently, year over year, matters more than picking the theoretically optimal investment.
What Salli adds is visibility: a live number, computed from your real ledger and your actual spending, that shows you exactly where you stand today and how a change to your budget moves the date. Not a guess, but a projection grounded in your own numbers rather than a generic average.
Sources
- Trinity Study (1998), Cooley, Hubbard, and Walz, Trinity University: the original 4% safe withdrawal rate research, based on US historical market data 1926–1997.
- The 25x / 4% rule is the standard derivation of "safe withdrawal rate" used across FIRE community planning tools and retirement-research literature.
The savings-rate table above is a simplified model for illustration: real portfolios don't grow in a straight 5%-a-year line, and your actual timeline will vary with market sequence, fees, and how your expenses change over time. Treat it as a compass, not a countdown clock.